


Communication is key to customer satisfaction
As a Customer Experience professional, you are tasked with creating a world-class experience for your customers. You are keenly focused on achieving the highest possible customer satisfaction ratings, maximizing customer retention, minimizing churn, and earning referrals from thoroughly satisfied customers.
Companies spend years building their brand and carefully cultivating their reputation. And while your company may spend millions of dollars on advertising, promotions and sponsorships, what really earns customer loyalty is when they have direct contact with someone from your company. For many companies that contact takes place in the form of a phone call. Whether receiving inbound calls or making outbound calls, this is where customer satisfaction is gained—or lost.
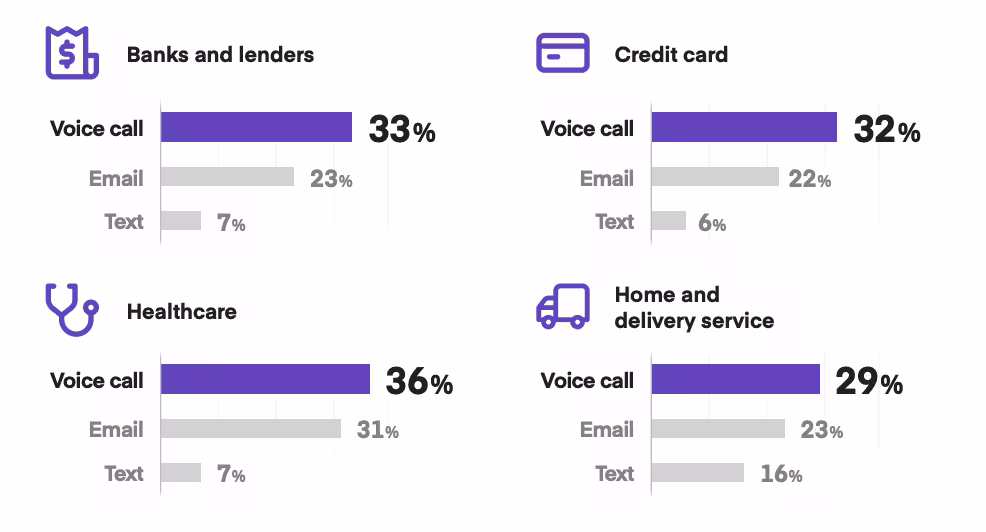
While electronic communication with customers has increased significantly over the last decade, the voice call remains one of the most personal and popular methods of communication. In Hiya’s State of the Call study of more than 12,000 consumers and 1,800 businesses, both groups reported that a voice call was their preferred method of communication. It beat out email, text messaging, video calls and chat.
If your company makes outbound calls, you know how difficult it can be to reach your customers. Yet, despite customers’ preference for voice calls, they don’t want to answer the phone. Why? Unwanted robocalls, spam and fraud calls are to blame.
Every day, individuals and businesses received more than 137 million unwanted calls. According to Hiya’s State of the Call Report, the average American receives 13 spam or fraud calls per month, and that number is higher in several European countries.
What does this have to do with Customer Experience? If you can’t connect with your customers via their preferred method of communication, it’s impossible to build a strong relationship that will keep them loyal to your brand.
To help, Hiya has put together this article specifically for Customer Experience professionals. It includes 7 key metrics that will help you gauge how satisfied your customers are. Some relate to your company’s overall reputation, while others apply specifically to your voice communications. At the end, we’ve included information on how Hiya can help you improve each of these metrics to help you create customers for life.
Metrics to measure
1. Customer satisfaction score
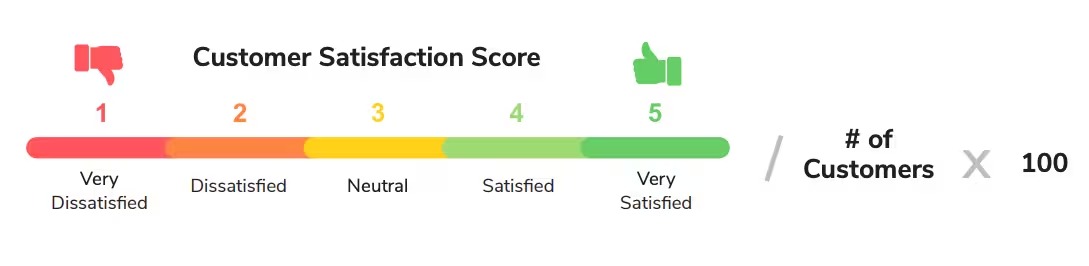
A Customer Satisfaction Score is a traditional metric that measures customers’ satisfaction with a business, a purchase, or an interaction. To collect the information to calculate this metric, customers are given a survey and asked to rate their satisfaction level from 1 to 5, with the latter being the highest rating. Then, the number of customers who answered with a 4 or 5 rating is divided by the total number of survey responses and multiplied by 100. For example, if 1,000 people responded to a survey and 800 of them gave a rating of 4 or 5, then the customer satisfaction score would be 80%. Scores above 75% generally indicate happy customers.With this metric and the others mentioned below, it’s important to track them over time. If customer satisfaction scores show an increase, you’re probably doing the right things and improving the customer experience. If your scores are falling, that’s not a good sign and you need to evaluate why.
2. Net promoter score
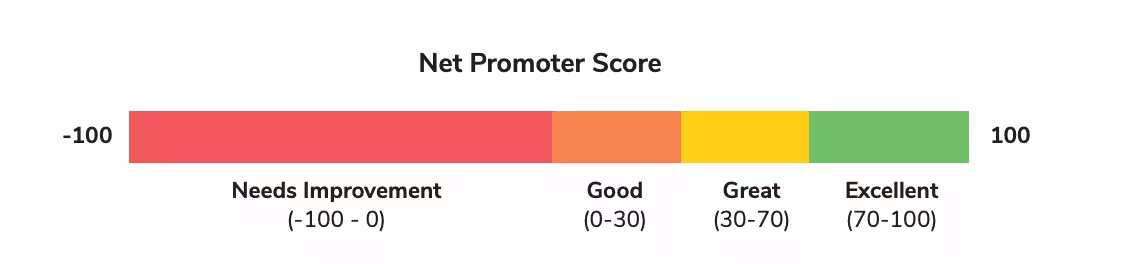
This is another commonly tracked metric because it reflects how the public feels about your company or your brand as a whole. While the Customer Satisfaction Score often measures short-term loyalty, the Net Promoter Score is used to gauge long-term customer loyalty.The Net Promoter Score is an index that ranges from -100 to +100 and measures the willingness of customers to recommend a company’s products or services. To start, customers are given a survey in which they rate the company. Depending on the score, customers are graded as promoters, passives, or detractors. The Net Promoter Score is assigned by taking the percent of promoters minus the percent of detractors. Negative scores indicate a company needs improvement. Scores between 0 and 30 are considered good; 30-70 are great, and 70-100 are excellent.
Again, this is a good metric to measure over time to ensure you’re making progress and continuously improving the customer experience.
3. Churn rate
Also known as the rate of attrition, the churn rate measures the rate at which customers stop doing business with an entity. It is most commonly expressed as the percentage of service subscribers who discontinue their subscriptions within a given time period. It’s an important metric to watch because the cost to acquire a new customer is usually much higher than it is to retain a current customer. A high churn rate could indicate that customers are unsatisfied with your service, or possibly that a competitor is luring away your customers. All businesses incur a certain amount of churn, so you’ll want to watch the rate over a period of months. A spike in your normal churn rate could indicate a problem that needs to be solved.
4. First contact resolution and first call close
First Contact Resolution is a metric that measures a company’s ability for its agents to resolve a customer’s inquiry or problem on the first call or contact. Solving customers’ problems during the initial interaction is regarded as an important metric because clients who have to contact companies on multiple occasions tend to have a negative experience. First Contact Resolution is calculated by dividing the total number of calls resolved on the first attempt by the number of calls placed.In outbound contact centers, First Call Close is the metric that measures how often agents are completing conversions the first time they speak with customers. A conversion could mean closing a sale, setting an appointment, or getting a customer to take a survey. First Call Close rates are not only a sign of an engaged audience, but lead to higher profits by reducing the amount of time spent on missed calls.
5. Queue time
Queue Time, also called First Response Time, is the amount of time customers have to wait before they start interacting with an agent. Stakeholders need to examine daily and weekly trends, plus they should carefully track the changes that occur over long periods of time. To calculate the Queue Time, divide the total time customers spent waiting by the number of requests. The lower the final value, the better for customer experience.Closely related to Queue Time is Active Waiting Calls. This metric is used to describe the number of customers who are waiting on hold for the initial interaction. When all agents are busy, clients have to wait. This metric can help contact centers determine whether there are enough agents to handle calls. High Active Waiting Call rates generally translate to a poor customer experience.

6. Call abandonment rate
Customers who spend a significant amount of time on hold are likely to hang-up and abandon their requests. This can create a negative experience and damage a company’s reputation, so stakeholders need to keep a close eye on call abandonment rates and keep them as low as possible. The abandonment rate is calculated differently for inbound and outbound contact centers. An outbound abandon is when a call connects to the dialed party but that party terminates the call prior to an agent being connected. With inbound call abandons, the rate is measured for each call that is queued for agent, but the caller ends the call before being connected to the agent.
7. Transfer rate
The transfer rate tells contact centers how many of the interactions handled are sent to another department for completion. The transfer rate is calculated by dividing the number of transferred calls by the number of total calls. Transfers are a nuisance for customers, so this number needs to remain low in order to improve the customer experience.
How Hiya can help you improve the customer experience
Improving the customer experience—and boosting the scores on all the metrics mentioned above—may seem like a daunting task. Fortunately, Hiya has solutions for some of the biggest customer headaches, especially as they relate to phone interactions.
Hiya’s State of the Call Report reveals that 80% of consumers won’t answer the phone if the call is unidentified. And a full 94% of consumers said they think that an unidentified call might be fraud. So how are you going to improve the customer experience if you can’t even reach them by phone? Hiya Connect could be the answer.
Hiya Connect Branded Call can help your company increase answer rates and improve efficiency by reducing the number of attempts your agents make to reach customers.
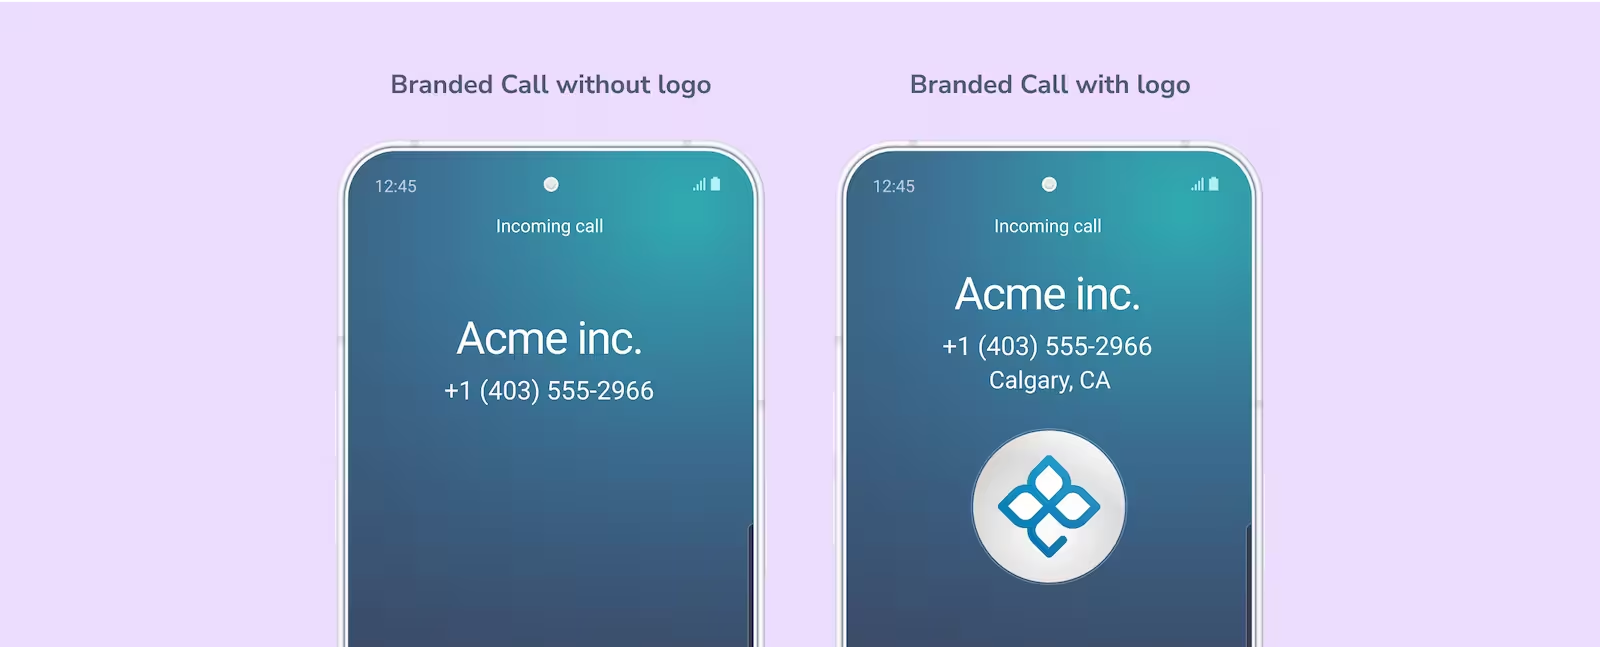
Advantages include:
- Be instantly recognized by displaying your company’s name on all outbound calls
- Elevate your brand by featuring your company logo.
- Give your customers context by including the reason for your call.
- Display your brand on the phones of over 200 million people globally. No other provider has a larger network of devices enabled to display branded caller ID.
Hiya Branded Call also has advanced analytics capabilities. Call Analytics & Insights enable you to:
- Understand which calls are being influenced by a Branded Call.
- See how a consistent, quality identity on outbound calls is improving key metrics.
- Track your company’s reputation health over time.
If you would like more information on how you can use Hiya Connect to improve customer satisfaction, please request a demo from our branded calling experts.


